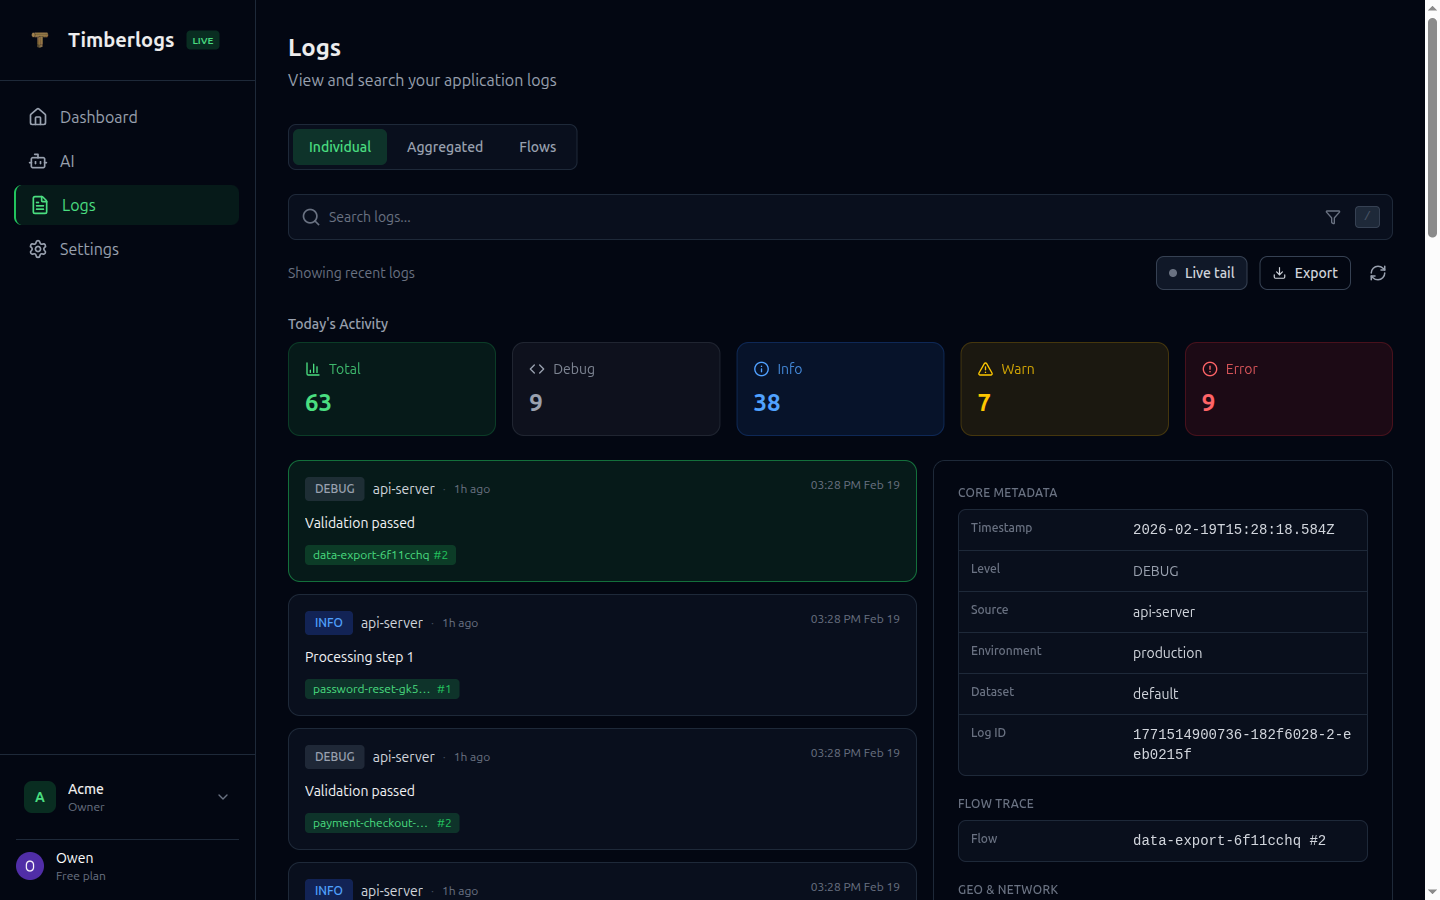
Log List
The main logs view displays logs in reverse chronological order (newest first).Log Row
Each log row shows:- Timestamp - When the log was created
- Level - Color-coded badge (debug, info, warn, error)
- Source - Application or service name
- Message - Log message (truncated)
Level Colors
Each log level is color-coded for quick scanning. See Log Levels for the full color reference.Filtering
Level Filter
Click the level dropdown to filter by log level:- All - Show all levels
- debug - Debug logs only
- info - Info and above
- warn - Warnings and errors
- error - Errors only
Source Filter
Type or select a source to filter logs from a specific service:Environment Filter
Filter by deployment environment:- development
- staging
- production
Time Range
Set a custom date range using the from and to datetime pickers.Search
Use the search bar to find logs by content.Basic Search
Type keywords to find matching logs:Phrase Search
Use quotes for exact phrases:Exclude Terms
Prefix with- to exclude:
OR Queries
UseOR between terms:
Log Detail View
Click any log row to expand it and see full details.Fields Displayed
- Full message - Complete log message
- Timestamp - Precise time with milliseconds
- Source - Application name
- Environment - Where the log originated
- Level - Log severity
- User ID - Associated user (if set)
- Session ID - Session identifier
- Request ID - Request correlation ID
- Dataset - Log routing dataset
- Version - Application version
- IP Address - Client IP address
- Country - Resolved country
Data Section
If the log includes structured data, it’s displayed as formatted JSON:Error Details
For error logs:- Error Name - The exception type
- Stack Trace - Full stack trace with line numbers
Tags
Tags are displayed as badges:Flow Information
If the log is part of a flow:- Flow ID - Links to flow timeline view
- Step Index - Position in the flow sequence
Loading More
Logs are loaded in batches. Click Load More at the bottom to fetch older logs.Copying Log Data
Copy Log ID
Click the copy icon next to a log to copy its ID.Copy JSON
In the detail view, click “Copy JSON” to copy the full log as JSON.Tips
Debugging Issues
- Filter to
errorlevel - Set appropriate time range
- Search for relevant keywords
- Expand logs to see stack traces
- Use request/session IDs for correlation
Monitoring
- Keep the view on
errororwarn - Set source filter to critical services
- Use flows for multi-step operations
Performance Analysis
- Search for “slow” or “timeout”
- Look at
datafield for timing info - Group by source to find problematic services