Getting Started
- Sign in at app.timberlogs.dev
- Create or select a workspace
- Generate an API key in Settings > API Keys
- Start sending logs using the SDK or API
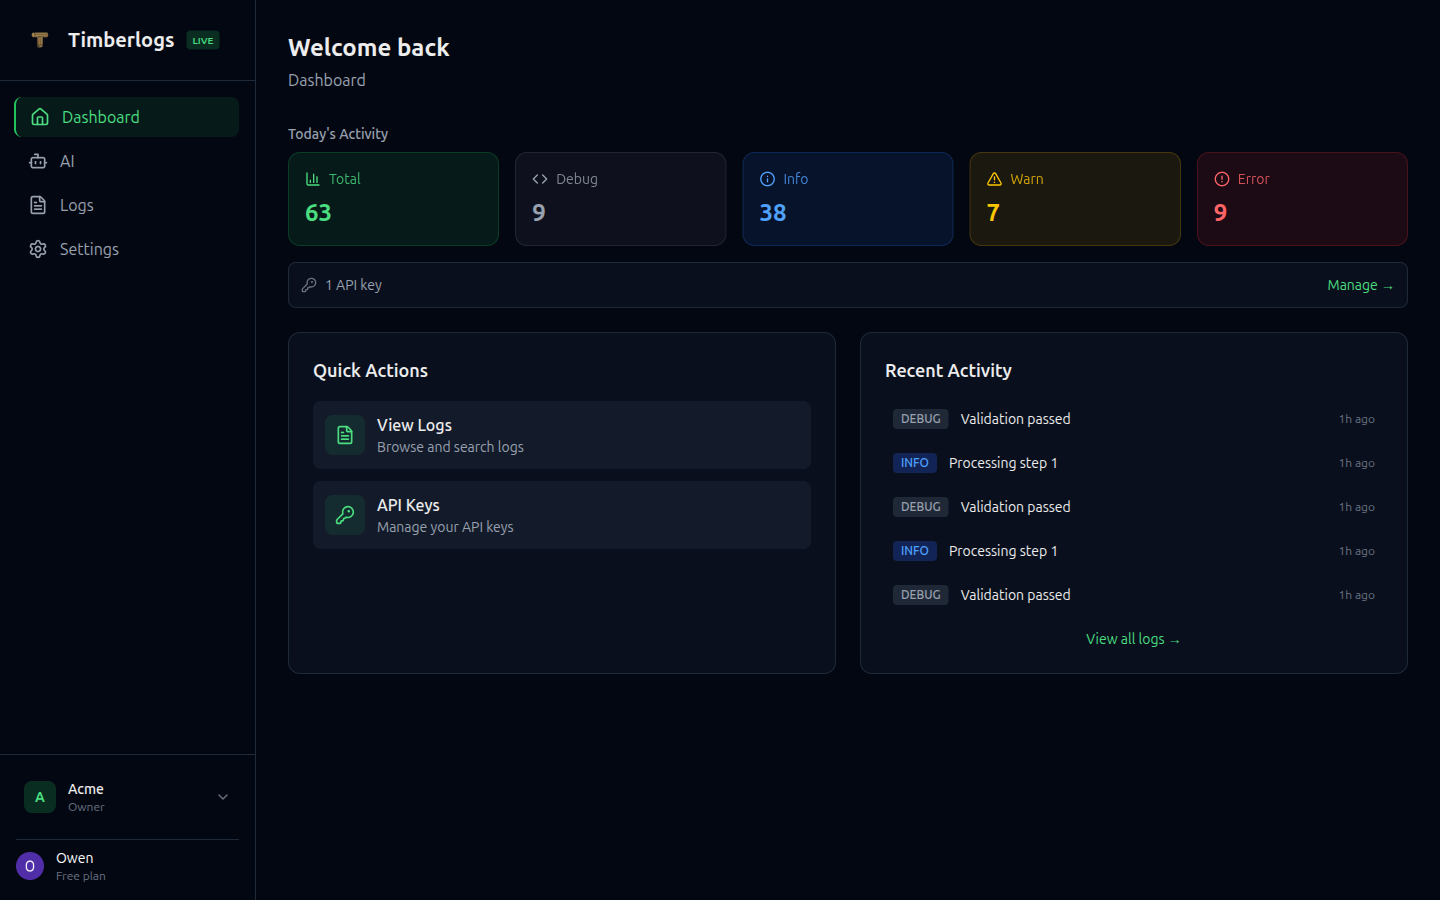
Dashboard Layout
Navigation
- Dashboard - Today’s activity, recent logs, and quick actions
- AI - Ask questions about your logs in plain English
- Logs - View and search all logs
- Settings - Manage API keys, alerts, sources, integrations, team, and billing
Workspace Selector
Switch between workspaces using the dropdown in the header. Each workspace has its own:- Logs and data
- API keys
- Team members
- Billing plan
Key Features
Real-time Log Viewing
- Logs appear within seconds of ingestion
- Click any log to expand and see full details
Filtering
Filter logs by:- Level - debug, info, warn, error
- Source - Application or service name
- Environment - development, staging, production
- Time range - Custom date range with from/to pickers
Search
Full-text search across log messages:- Simple keyword search
- Phrase matching with quotes
- Exclude terms with
- - OR queries for alternatives
Log Detail View
Click any log row to expand and see:- Full message text
- Structured data (JSON)
- Error stack traces
- All metadata fields
- Tags
Flow Tracking
View related logs grouped by flow:- See all steps in a multi-step process
- Track timing between steps
- Debug user journeys end-to-end
Data Retention
Log retention depends on your plan:
Logs are automatically deleted after the retention period.